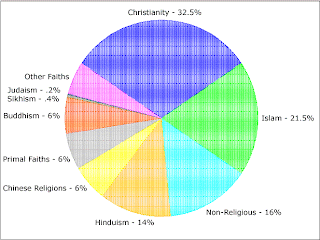
Certainly a type of geovisualization, this pie chart is displayed in circular form. Pie charts divide the information they represent by sections. As shown, this “pie” represents in percentages the amount of people belonging to a religion in the world.
No comments:
Post a Comment